Quality Was the Point of Agile Coaching
Agile coaching originally centered on software quality, technical excellence, and feedback. Then the market rewarded ...
9 min read
03.02.2026, By Stephan Schwab

Organizations often reach for elaborate management frameworks when they cannot see what is actually happening. But the root problem isn't missing process — it's missing visibility. Visualization provides the same diagnostic power without the bureaucratic overhead, revealing delivery reality through simple, observable signals rather than complex role hierarchies and ceremony schedules.
Most organizations that adopt heavy management frameworks do so because they feel blind. Work happens somewhere. Money goes out. Occasionally software appears. The connection between investment and outcome feels opaque, unpredictable, and slightly magical.
This blindness triggers a predictable response: if we can’t see what’s happening, we should mandate a process that tells us what should happen. Framework vendors understand this anxiety intimately. Their sales pitch addresses it directly — adopt our roles, our ceremonies, our artifacts, and clarity will emerge.
But the clarity that emerges is process compliance, not delivery reality. Organizations gain visibility into whether teams held their standups and completed their sprint planning. They learn nothing about whether the work matters, whether customers use what ships, or whether the codebase is healthy enough to sustain continued development. This dynamic — where frameworks diagnose symptoms but cannot repair root causes — explains why so many transformations stall.
When a management framework promises visibility, examine what becomes visible:
Role occupancy. You know who fills which framework-defined position. You have a Product Owner, three Scrum Masters, and a Release Train Engineer. Whether any of them possess the skills to do their jobs effectively remains invisible.
Ceremony completion. You know that teams held retrospectives last week. What you don’t know is whether anyone acted on insights or whether the retrospective was theater — people going through motions because the calendar demanded it.
Artifact production. You know that user stories exist, that they have acceptance criteria, that someone estimated them in story points. The relationship between these artifacts and actual work done remains tenuous. Teams learn to write stories that satisfy process auditors, not stories that clarify intent.
Velocity metrics. You know that teams claim to complete a certain number of points per sprint. But story points are internally defined, inconsistently sized, and easily gamed. Comparing velocity across teams is meaningless. Comparing a team’s velocity across time requires that nothing else changed — an assumption that never holds.
None of this answers what executives actually need to know: Is work flowing from idea to production? Are we building things users want? Is the codebase sustainable? Where should we invest next?
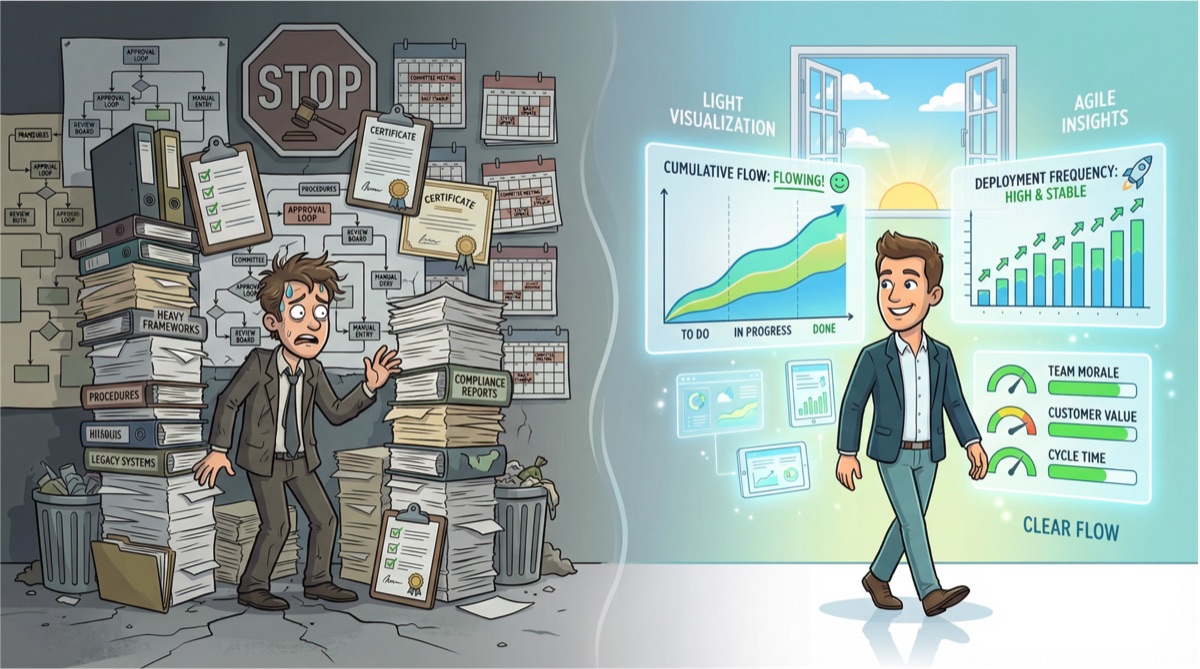
Simple visualization techniques — requiring no framework adoption, no role changes, no certification expenditure — reveal delivery reality directly:
Cumulative flow diagrams show work accumulating in each stage over time. When the “in development” band grows while “deployed” stays flat, work is starting but not finishing. No ceremony audit reveals this pattern; the shape makes it obvious instantly.
Lead time distributions show how long work items take from commitment to delivery. The shape tells the story — a tight cluster suggests predictable flow; a long tail suggests some work gets stuck. Executives can see this without understanding engineering details.
Deployment frequency tracked over time shows whether the pipeline is flowing or constrained. If deployments decrease while headcount increases, something is consuming energy that isn’t reaching production. As explored in Technical Practices That Drive Business Results, deployment frequency is one of the key metrics that connects engineering practice to business outcomes.
Escaped defect rates show quality problems that reach users. This is more honest than test coverage metrics or story point completion. Either users experience problems or they don’t.
Pipeline dashboards show builds passing or failing in real time. Red builds that persist for days indicate development health problems no standup report captures.
These automated signals reveal much — but not everything. Some delivery friction lives in human context: unclear requirements, coordination issues, blockers that emerge between commits. For these signals, lightweight collaborative logging provides visibility without ceremony overhead. Tools like Caimito Navigator transform brief daily entries into synthesized weekly intelligence — surfacing patterns invisible in status meetings while giving executives strategic visibility without disrupting the team.
These visualizations share a critical property: they derive from systems rather than from ritual. No one can game what the build server records or spin a lead time distribution. Daily entries compound into organizational intelligence that reveals where teams are stuck, what’s accelerating, and where capacity is constrained. The data exists regardless of what anyone claims in a status meeting.
If visualization is simpler and more honest, why do organizations buy frameworks instead?
Frameworks feel like action. Commissioning a transformation, hiring consultants, training everyone — these are visible investments. Building a dashboard feels passive, even though the dashboard produces more actionable insight.
Frameworks assign blame elsewhere. When things go wrong, the framework provides vocabulary for attributing failure — teams lacked maturity, the organization resisted change, we need more training. Visualizations offer no such comfort. They show what happened without explaining it away.
Frameworks create jobs. Process roles don’t ship software, but they do employ people who attend meetings, produce slide decks, and coordinate calendars. This creates a constituency that defends the framework’s existence.
Frameworks feel comprehensive. A diagram with fourteen boxes connected by arrows looks like a complete solution. A simple dashboard looks like it might be missing something. Executives often equate complexity with thoroughness.
Visualization requires engineering capability. Building effective dashboards requires access to data, understanding of what to measure, and technical skill to surface it clearly. Organizations that lack engineering fluency can’t build their own visibility — so they buy packaged frameworks instead.
Management frameworks often include reporting tools — burndown charts in Jira, PI objectives in SAFe dashboards, OKR tracking software. These create an illusion of data-driven management while missing the fundamental problem.
Framework dashboards report on framework artifacts. They tell you about story completion rates, sprint commitments, and planning increment progress. They do not tell you about actual software reaching actual users.
The data that matters lives in engineering systems: source control, CI/CD pipelines, production telemetry, incident management. Framework overlays rarely connect to this layer. They create a parallel universe of process data that management watches while the real delivery story goes unobserved.
Organizations that understand this invest in connecting their visualization to their engineering systems. They show deployments, not sprint completion. They track lead time from commit to production, not from story creation to acceptance. They measure user adoption, not feature acceptance by a Product Owner.
Building useful visibility doesn’t require buying anything or reorganizing anyone:
Step one: Identify one real question. Not “are we agile?” but “how often do we deploy to production?” Not “are teams performing?” but “how long does work take from start to finish?”
Step two: Find the source of truth. The deployment timestamp lives in your CI/CD system. The work start and end dates live in your issue tracker. The production error rate lives in your monitoring. These systems already contain the data.
Step three: Make it visible. A shared screen displaying deployment frequency. A weekly email with lead time distributions. A Slack integration that announces each production deployment. Start simple; sophistication can come later.
Step four: Act on what you see. If lead times are long, investigate where work stalls. If deployments are rare, understand what’s blocking flow. The visualization exists to prompt inquiry, not to provide answers.
Step five: Repeat with the next question. Over time, a small collection of visualizations creates comprehensive delivery insight. Each one emerged from a genuine question, so each one stays relevant.
Step six: Capture human context. Automated systems miss blockers, unclear requirements, and coordination friction. Brief daily logbook entries — stating the day’s heading, noting surprises, capturing outcomes — compound into organizational intelligence. Weekly synthesis reveals patterns: where teams are stuck, what’s accelerating, where capacity is constrained. Leaders gain evidence-based insight without scheduling another meeting.
This approach costs nothing. It requires no training, no certification, no consultant engagement. It produces genuine insight rather than process compliance data.
Not all framework adoption is misguided. Frameworks provide value when:
Organizations genuinely lack shared vocabulary. If teams describe work completely differently, common terms reduce confusion. Frameworks provide terminology that enables cross-team conversation.
Diagnosis is the goal. Applying a framework briefly to diagnose organizational patterns can reveal dysfunction. The framework provides a lens for analysis, not a permanent operating model.
Coordination at scale requires some structure. Very large organizations benefit from predictable integration points. The question is whether you need the entire framework or just the coordination mechanisms.
Learning is the intent. Teams new to iterative delivery may learn faster with a structured starting point than with pure experimentation.
The key distinction: using a framework as a learning scaffold differs from adopting it as a permanent operating model. Scaffolding comes down when the building stands. Frameworks often persist indefinitely, their ceremonies continuing long after anyone remembers why they started.
Choosing frameworks over visualization carries real costs:
Direct expense. Training, consulting, certification renewals, and tooling subscriptions add up. Visualization built on existing engineering infrastructure costs development time only.
Opportunity cost. Every hour spent in framework ceremonies is an hour not spent writing software, fixing defects, or talking to users. Visualization requires maintenance measured in minutes per week.
Technical capability atrophy. When organizations outsource improvement to methodology, they stop developing internal capability to understand and fix their own systems. Visualization requires — and builds — engineering fluency.
False confidence. Framework metrics can look healthy while delivery stalls. Visualization connected to engineering reality cannot lie in the same way.
Delayed learning. When feedback comes through ceremony-based retrospectives instead of real-time dashboards, organizations learn slowly. Problems that persist for sprints could have been caught in hours.
Organizations seeking delivery visibility face a choice. They can buy a framework — adopting roles, ceremonies, and a belief system along with reporting tools disconnected from engineering reality. Or they can build visualization — connecting simple displays to the systems that actually produce software.
The framework path offers comfort, external validation, and someone else to blame when things go wrong. The visualization path offers accuracy, low overhead, and the discomfort of seeing reality clearly.
Reality, even when uncomfortable, is where improvement begins. You cannot fix what you cannot see. You cannot see clearly through a framework built to obscure as much as it reveals.
Start simple. Pick one question that matters. Make the answer visible. Watch what happens when everyone shares the same view of reality.
The best governance is the lightest governance that still provides clarity. As explored in How to Govern Without Control, effective leadership replaces permission with visibility. For most organizations, that means visualization first, frameworks never — or frameworks only after simpler approaches have been exhausted and found genuinely insufficient.
Let's talk about your real situation. Want to accelerate delivery, remove technical blockers, or validate whether an idea deserves more investment? I listen to your context and give 1-2 practical recommendations. No pitch, no obligation. Confidential and direct.
Need help? Practical advice, no pitch.
Let's Work TogetherTelenovelas show what we can't say in client meetings. The drama is heightened, but the patterns are real.
 Never Missed a Run
Two coffins sink into wet Ohio ground, and Graham Whitaker inherits the company his father built in COBOL and stubborn pride. Weeks later, the busi...
 The Q3 Planning Crisis
Pixel Spree enters Q3 planning under heavy pressure from leadership to deliver ambitious new features. Lukas pushes for aggressive growth targets, ...
Embedded into your team as an active contributor, reducing delivery friction and helping important work move cleanly.
Peer-style technical assessments before far-reaching decisions; reduce architectural and product risk early.
Ship working software to real users earlier. Measure impact and adapt based on evidence rather than assumption.
High quality, maintainable software. Short-term augmentation that leaves lasting capability in your own team.
Visibility and hands-on delivery
Navigator gives your leadership clear insight into patterns, blockers, and capacity. Our Developer Advocate writes production code with your team and gets delivery moving.